Overview
For a select set of species we have analyzed the complete genomes with RepeatMasker and offer the results in various formats. The sequence alignments and complete annotations output ( *.out file ) are available for each of the listed species and in some cases for several assemblies and/or versions of RepeatMasker. These datasets were generated using the computing resources at UCSC. In some cases they will be newer than the version available in the genome tracks at UCSC.
In addition we also provide interactive repeat landscape graphs for each species.
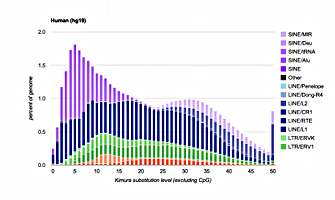
The repeat landscapes depict the relative abundance of repeat classes in the genome versus the Kimura divergence from the consensus. The above example is for the human hg19 assembly. Larger graphs with interactive features may be found on the species specific pages listed below.
Datasets
Use the following species graph to navigate to your species of interest. Click on the colored boxes to go to the specific dataset. If your browser doesn't support HTML5 canvas please try this alternate view.
Silhouettes created by Deanna Smit